In this project we analyse bank loan data to evaluate loan performance, risk distribution,
customer repayment behaviour and portfolio health using SQL, Power BI

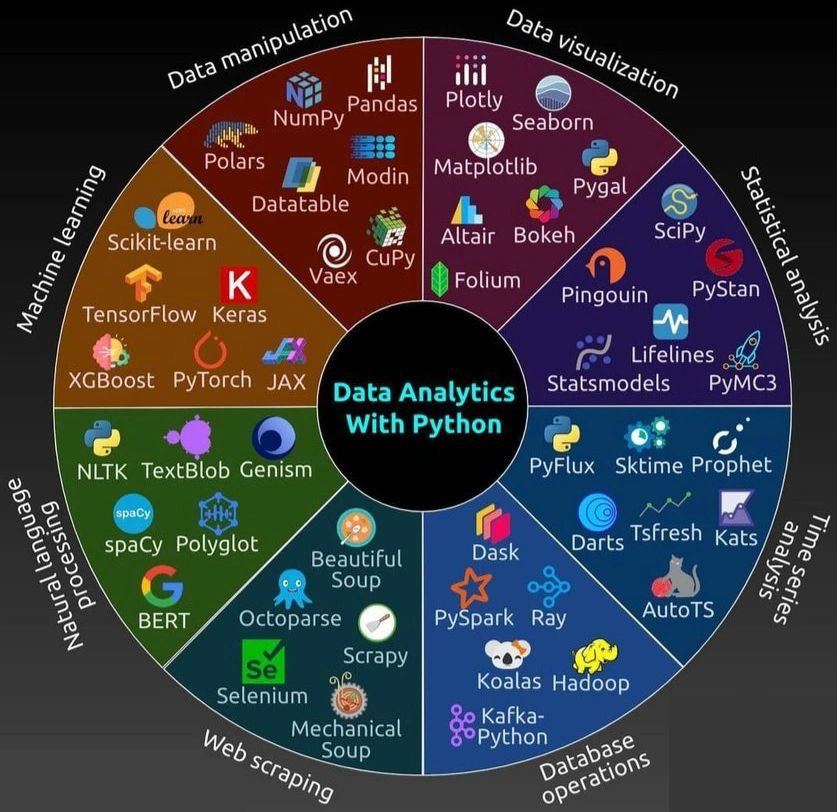
A structured, end-to-end collection of Jupyter Notebooks covering Python from fundamentals to data visualization. This project is designed as a progressive learning series — each notebook builds on the previous one, taking you from core Python programming all the way through NumPy, Pandas, and Matplotlib/Seaborn visualizations.
Built by a practicing Data Analyst as a hands-on reference and portfolio project.

A collection of standalone Python projects demonstrating real-world programming concepts including Object-Oriented Programming, financial calculations, data validation, and full console application development.

In this project we Analysed an end-to-end business funnel (Lead → Trial → Enrolment → Retention). Identified an 18% conversion drop-off between Trial and Enrolment stages and a 12% retention differential across customer cohorts using SQL and Excel. Built Tableau dashboards visualising KPIs including Conversion Rate, Retention %, and Revenue per Customer. Documented all data definitions and cleaning logic for reproducibility.

This project focuses on analyzing pizza sales data to derive meaningful business insights related to revenue, customer ordering patterns, and product performance.
SQL was used to calculate KPIs and perform trend analysis, while Power BI was used to design an interactive dashboard for visualization and decision-making.

This repository contains a gaming analytics case study demonstrating how SQL can be used to perform data validation, analyze player engagement, retention, and monetization, and translate query results into business insights.

This project is a complete SQL-based analysis of a simulated T20 World Cup 2026 tournament. It includes database creation, data insertion, and analytical queries to extract meaningful insights from match and player data

This project analyzes employee termination data for Brightness, a hypermarket chain, to evaluate workforce exit patterns and project future termination trends.
The objective was to translate structured HR business questions into data-driven insights using Microsoft Excel